
The Western Cape water crisis has eased considerably over the winter period to date much to the relief of residents who while still seeing no relief from the conservation measures at least do not have to confront the spectre of Day Zero when the taps would run dry. The table shows how the situation has improved markedly over both the April end of summer position and that of a year ago. But certainly not ideal and not at the levels of three and four years ago.
| Capacity | 20.8.18 | 23.4.18 | 20.8.17 | |
| Dam | million m3 | % | % | % |
| Theewaterskloof | 479 | 43.9 | 10.1 | 24.7 |
| Voëlvlei | 159 | 64.9 | 13.7 | 23.9 |
| Berg River | 127 | 89.8 | 36.2 | 50.6 |
| Wemmershoek | 59 | 83.6 | 44.9 | 40.4 |
| Steenbras Lower | 34 | 66.1 | 36.7 | 28.1 |
| Steenbras Upper | 32 | 102.3 | 62.9 | 96.6 |
| Six dam total | 890 | 59.8 | 19.7 | 32.0 |
| W Cape total | 1 866 | 53.6 | 16.0 | 30.8 |
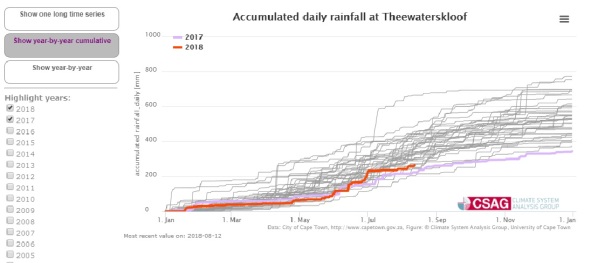
Yet this improvement has occurred despite some rainfall figures not showing a great improvement over the previous year. The chart below for rainfall at Theewaterskloof since 1981 indicates a latest figure for 2018 (red line) only 40mm higher than the previous year (lilac line) which does not seem to begin to explain the dam level improvement, especially as the catchment area is so limited. I was interested to see whether water is transferred into Theewaterskloof from other catchments but found no references to this. The rainfall at the dam in the four months time interval between the first two columns of figures above was 216mm. The amount of water falling in the 500km2 catchment, assuming little variability over that area, would thus be 108 million m3. Yet the 34% increase in the dam level represents a 163 million m3 increase. The discrepancy in the two figures is very large even before accounting for soil absorption, evaporation and offtake. [The soil would initially have been very dry, the water table very low and the evaporation from the shallow dam is great.] The difference is even more striking between the change in dam levels in 2018 and that in the similar period in 2017 (34% v 7%) with no great difference in rainfall but possibly significantly different offtake.
At Steenbras the year to date increase in rainfall over 2017 is 165mm but still leaving 2018 to date as the second driest in 40 years. On the other hand the patchiness of the rainfall is illustrated by the rainfall at Voelvlei, close to Tulbagh, being the sixth highest in 18 years and at Wemmershoek to the SE of Paarl the 2018 figure is 426mm higher than 2017 and around the eighth highest in 48.
As for South Africa and Lesotho as a whole the dry season over the great majority of the region has seen dam levels reducing only 5% points in the last four months with all provinces except Limpopo showing an increase over a year ago. Although Eastern Cape dams share in that increase the low level of the Kouga dam is a concern (see previous blog). A much bigger problem seems to lie with the Lesotho dams which one might have hoped would have shared similar figures with those for the Free State. In four months levels have decreased by 13% points at a time when it might have been assumed there was no requirement to transfer water to the Free State system. The reason is apparently the need to introduce clean water to dilute the heavy pollution of the Vaal. Even so the situation appears rather odd. If the pollution is mainly downstream of Vaaldam, as seems definitely the case, why not release Vaaldam water to dilute the pollution to minimise overall evaporation, just as Sterkfontein is kept close to full until Vaaldam reaches very low levels.
| Capacity | 20.8.18 | 23.4.18 | 20.8.17 | |
| Dam | million m3 | % | % | % |
| Sterkfontein | 2 617 | 95 | 96 | 92 |
| Vaal | 2 604 | 95 | 106 | 91 |
| Bloemhof | 1 240 | 101 | 104 | 98 |
| Vanderkloof | 3 171 | 98 | 102 | 80 |
| Gariep | 5 196 | 91 | 105 | 71 |
| Free State total | 15 971 | 92 | 100 | 79 |
| W Cape total | 1 866 | 54 | 16 | 31 |
| kZN total | 4 669 | 63 | 65 | 52 |
| Kouga | 126 | 7 | n.a. | 15 |
| E Cape total | 1 826 | 61 | 68 | 55 |
| Limpopo total | 1 508 | 70 | 77 | 74 |
| Katse / Mohale (Lesotho) | 2 376 | 44 | 57 | 42 |
| Mpumalanga total | 2 520 | 78 | 82 | 75 |
| Total RSA and Lesotho | 31 913 | 77 | 82 | 68 |
Sources: http://www.csag.uct.ac.za; Wikipedia; Dept of Water and Sanitation.
